Technical Analysis
Key Components of Technical Analysis
Demystifying Support and Resistance in Stock Trading
In the dynamic world of stock trading, understanding the concepts of support and resistance can be the key to unlocking profitable opportunities. These fundamental pillars of technical analysis provide valuable insights into a stock's potential price movements. In this blog, we'll delve deeper into what support and resistance are, how they work, and why they matter to traders and investors.
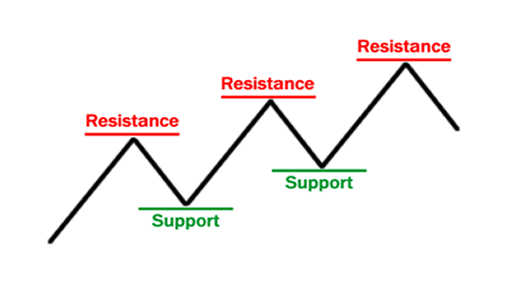
Support:
Imagine support as a solid floor beneath a stock's price. It's a price level where the stock tends to stop falling and may even bounce back up. Traders often view support as a buying opportunity because historical data suggests that the stock's decline might be limited.

Resistance:
Picture resistance as a sturdy ceiling above a stock's price. It's a price level where the stock often stops rising and may turn back down. Traders tend to see resistance as a selling opportunity because it signifies that the stock's upward movement might be restrained.
The Role of Trendlines

Uptrend
An ascending trendline, connecting higher lows, suggests an upward trend.

Downtrend
A descending trendline, connecting lower highs, indicates a downward trend.

Trending Range
In this trend the price keeps oscillating between 2 lines back and forth.
Why Support and Resistance Matter
Support and resistance aren't just theoretical concepts; they hold practical significance in stock trading:
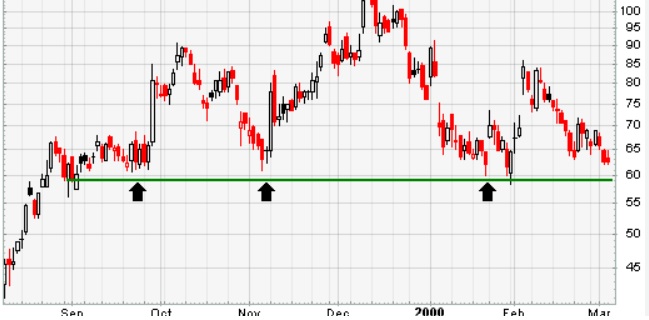
Price Barriers: These levels act as invisible barriers where supply and demand forces meet. When a stock approaches support, buyers tend to outnumber sellers, creating upward pressure. Conversely, at resistance, sellers tend to dominate, causing downward pressure.

Identifying Support, Resistance
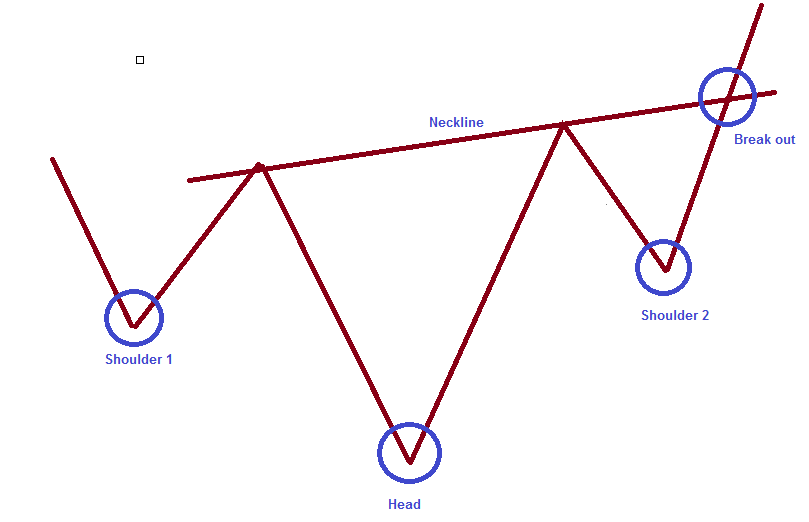
Recognizing these levels and trendlines isn't always straightforward. Traders use various methods, such as chart patterns, moving averages, psychological levels, and volume analysis.
The Role of Moving Averages
Moving averages are another vital element in stock analysis. These are calculated by averaging the stock's prices over a specific period. The most commonly used moving averages are:

"It calculates the average price over a specified number of periods, treating each period's data equally. For example, a 50-day SMA calculates the average of the last 50 closing prices"

"This moving average gives more weight to recent prices, making it more responsive to recent market changes"


Final Thoughts
Support and resistance are more than just abstract concepts; they are vital tools for traders and investors. These levels help traders make informed decisions, manage risk, and understand a stock's potential price movements. While they aren't foolproof, combining support and resistance analysis with other forms of technical and fundamental analysis can provide a comprehensive view of the market, enhancing your ability to navigate the complex world of stock trading.
