Technical Analysis
Key Components of Technical Analysis
Unlocking the Power of Stock Trading Indicators
In the world of stock trading, knowledge is power. And one of the most powerful tools at your disposal is the use of technical indicators. These tools provide a systematic and data-driven way to analyze market conditions, assess price movements, and make informed trading decisions.

What Are Stock Trading Indicators?
Stock trading indicators are mathematical calculations or data-based visual representations that offer insights into a stock's past, current, or potential future price movements. They help traders and investors make more informed decisions by providing a systematic and quantitative way to evaluate market conditions. Our "Indicators" page is your gateway to understanding the world of technical analysis and how these tools can enhance your trading strategies.

Types of Stock Trading Indicators
Moving Averages:
Moving averages smooth price data over specific time periods, helping traders identify trends. For example, a Simple Moving Average (SMA) calculates the average price over a specific number of periods and is used to identify trends in stock prices.
"A 50-day SMA is commonly used to identify the long-term trend of a stock. If the stock's price is consistently above the 50-day SMA, it suggests an uptrend."

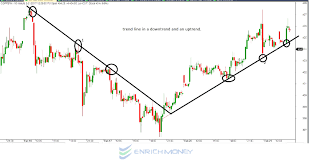
Trendlines:
Trendlines are drawn on price charts to connect consecutive lows in an uptrend or highs in a downtrend. They provide visual guidance on the direction and strength of a stock's trend.
"An ascending trendline connecting higher lows suggests an upward trend, while a descending trendline connecting lower highs indicates a downtrend."